Troubleshooting: Analysing Generation Performance & Process
When your dungeon generation isn't working as expected, whether it's failing frequently, taking too long, or producing undesirable layouts, you need ways to diagnose the problem. DunGen provides tools and features to help you analyse the performance and visualize the step-by-step process of dungeon creation.
Generation Statistics
The generation statistics window provides some simple information about your successful dungeon generation.
- What it Does: Provides a list of basic statistics including total generation time, the number of rooms of each type that were spawned, total retry count, and how long each step in the generation process took.
- How to Use:
- Open the generation statistics window (
Window > DunGen > Generation Stats). - Generate a dungeon. This can be done at runtime using the
Runtime Dungeoncomponent or in the editor (Window > DunGen > Generate Dungeon). - The window will update to show that stats of the last generated dungeon. Generating another dungeon will update the stats for the new dungeon generation.
- Open the generation statistics window (
Runtime Analyzer Component
For quantitative analysis, especially regarding performance and success rates over multiple runs, DunGen provides the Runtime Analyzer component.
- What it Does: This component repeatedly generates dungeons using specified settings and gathers statistics about the process, such as average generation time, failure rates, and time spent on different generation steps. Once the analysis is complete, it outputs the results to the dungeon analysis window for review.
- How to Use:
- Add the
Runtime Analyzercomponent to a GameObject in your scene (or use the provided sceneAssets/DunGen/Samples/Basic/Analysis Scene.unity). - Configure the
Runtime Analyzersettings (select theDungeonFlow, number of iterations, etc.). - Enter Play mode.
- Add the
- What Information it Provides:
- Total number of successful generations vs. attempts.
- Average time taken per successful generation.
- Average time spent on specific phases (e.g., Main Path Generation, Branch Path Generation, Post-Processing).
- Average number of rooms in total, as well as individually on the Main Path and Branch Paths.
- The metrics provided come from a set of modules which can be enabled or disabled as needed by modifying the 'Analysis Modules' list in the
Runtime Analyzercomponent. - Custom modules can be added to gather additional metrics as needed.
- Why it's Useful:
- Identifies performance bottlenecks (which step takes the longest?).
- Quantifies the impact of changes (e.g., did adding more complex tiles significantly increase generation time?).
- Helps determine if generation failures are frequent or rare under specific rule sets.
Dungeon Analysis Window
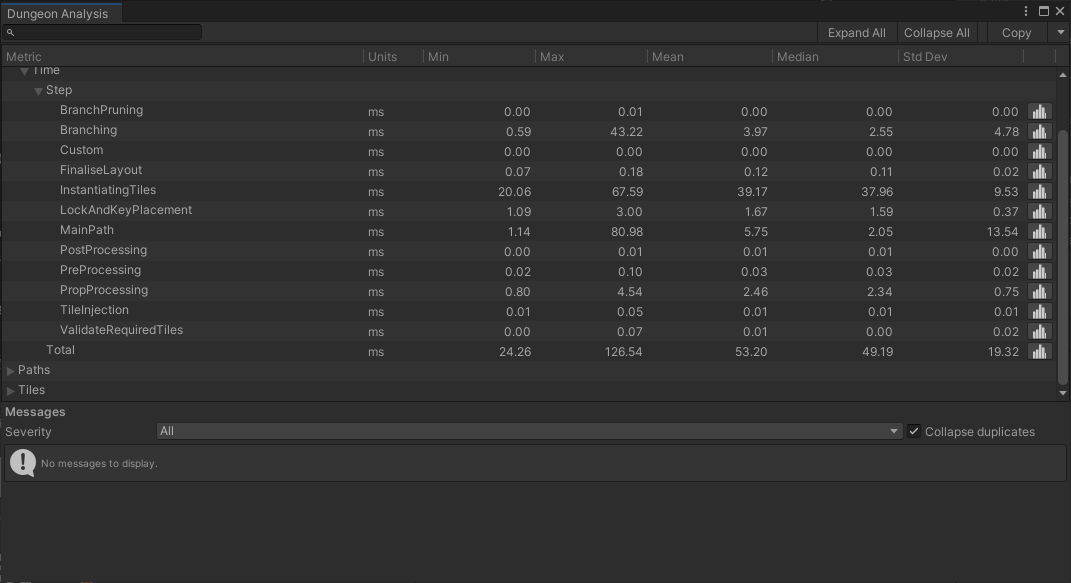
The dungeon analysis window displays detailed statistics and breakdowns of dungeon generation performance in a tree view format.
The dungeon analysis window will appear automatically after analysis completes and displays analysis results in a tree view format, allowing you to explore detailed statistics and breakdowns of dungeon generation performance.
- Search Bar: Quickly find specific metrics or categories by typing keywords.
- Tree View: Expand and collapse categories to view detailed statistics about different aspects of the dungeon generation and the dungeon layout.
- Histogram View: Visualize distributions of each metric (e.g., generation times, room counts) using histograms for better insight into performance characteristics and layout results.
- Copy Button: Copy the displayed analysis data to the clipboard for easy sharing or documentation. Can be copied in tab-separated format for pasting into spreadsheets, and in a human-readable indented table for viewing in a text document (works best with a mono-spaced font).
- Message Area: Displays important messages or warnings related to the analysis results. Messages can be filtered by severity (Info, Warning, Error) and duplicates can be collapsed for clarity.
Built-in Analysis Modules
Generation Stats
Gathers basic statistics about generation performance, including total generation time, number of tiles spawned (broken down by type), retry counts, and time taken for each generation step.
Path Lengths
Collects data on the lengths of the main path and branch paths in the generated dungeons, providing insights into layout complexity and variety.
Props
Records the number of instances of each global prop by ID placed in the generated dungeons.
Tile Prefab Usage
Tracks how often each tile prefab is used across all generated dungeons, helping identify overused or underutilized tiles in your tile set.
Dungeon Validation
Doesn't produce any metrics, but runs through a list of checks to enure that the dungeon was generated correctly. If any issues are found, they are reported as warnings or errors in the analysis results.
This can help identify problems with your dungeon flow, tile set, or generation rules that may lead to unexpected layouts or generation failures. This module is quiet heavy on performance, so it is recommended to only enable it when debugging issues.
Errors denote issues with the dungeon that should not have happened, such as violations of hard rules.
Warnings indicate potential problems where a soft rule was broken (e.g., a branch path was shorter than the minimum length specified).
Custom Analysis Modules
DunGen's analysis system is extensible, allowing you to create custom analysis modules to gather specific metrics or perform specialized evaluations of your dungeon generation.
To create a custom analysis module, implement the IGenerationAnalysisModule interface on a new class and add it to the list of analysis modules in the Runtime Analyzer component. Your module can then collect data during each generation cycle and contribute to the final analysis report. Any serialized fields on your module will be exposed in the inspector for configuration.
Example:
using DunGen;
using DunGen.Analysis;
using DunGen.Tags;
using System;

[Serializable]
public class CustomAnalysisModule : IGenerationAnalysisModule
{
    // A tag that can be set in the inspector to specify which tiles are considered important
    public Tag ImportantTag;


    // We're only interested in collecting statistics when a dungeon is successfully generated
    // so we can leave the other methods empty.
    public void OnAnalysisEnded(AnalysisResults results) { }
    public void OnAnalysisStarted(AnalysisResults results) { }
    public void OnDungeonGenerationFailed(AnalysisResults results, GenerationStats stats) { }


    // Called each time a dungeon is successfully generated
    public void OnDungeonGenerated(AnalysisResults results, Dungeon dungeon, GenerationStats stats)
    {
        // Count the number of tiles with the ImportantTag tag
        int importantTileCount = 0;

        foreach (var tile in dungeon.AllTiles)
        {
            if (tile.Tags.HasTag(ImportantTag))
                importantTileCount++;
        }

        // Store the result in a dot-separated key so it appears under a hierarchy in the analysis report
        results.AddValue("MyCustomModule.ImportantTileCount", importantTileCount);

        // If no important tiles were used, add a warning message to the report
        if (importantTileCount == 0)
            results.Warning("No important tiles were used in the generated dungeon.");
    }
}
Asynchronous Generation Visualization
Sometimes, seeing how the dungeon is built step-by-step is more revealing than statistics, especially when debugging layout failures or unexpected tile placements. You can achieve this using DunGen's asynchronous generation mode with pauses.
- What it Does: Allows DunGen to generate the dungeon over multiple frames and optionally pause after placing each Tile, letting you watch the process unfold in the Scene view.
- How to Enable:
- Select the GameObject containing your
Runtime Dungeoncomponent. - In the Inspector, find these settings:
Generate Asynchronously: Check this box. This tells DunGen not to block the main thread during generation, enabling pauses.Pause Between Rooms: Set this to a small positive value (e.g.,0.5or1.0). This is the duration (in seconds) DunGen will pause after placing each room/tile. A value of0means no pause.
- Enter Play mode. Observe the Scene view as the dungeon constructs itself incrementally.
- Select the GameObject containing your
- Why it's Useful:
- Visual Debugging: See the exact order tiles are placed and connected.
- Failure Point Identification: If generation fails, you can often see exactly which tile placement failed or where the process got stuck.
- Understanding Logic: Visually grasp how main path vs. branch path generation proceeds, how connection rules are applied, or why certain areas might be unreachable.
- Collision Issues: Helps spot if tiles are colliding unexpectedly with each other or scene objects during placement.
By utilizing the Runtime Analyzer for performance metrics and asynchronous visualization for process debugging, you gain valuable insights into how DunGen is operating, making it much easier to troubleshoot issues and optimize your procedural dungeon generation setup.